


|
|
Maps are a very important tool when trying to navigate from one location to another. It informs the user of obstacles that they may face along the
way and also the safest route. However with any tool, maps are only useful when the user knows how to interpret it. There are also many types of
maps; however, while in the outdoors, the map of choice is the topographical map.
|
The Grid
The first item you would notice when reading a map is that there are lines that form a grid on the surface; this is formed by the longitude and
latitude lines. Longitude lines are lines that run from north to south that measures degree from the prime meridian whereas the latitude lines
are lines that run from east to west that measures the degree from the equator. Just like a graph in math class, by knowing the x and y
coordinates, a user can pinpoint their exact location on the map.
|
Oh pretty colors and pictures
To help the user quickly identify obstacles and resources on the map, mapmakers have devised a color schema and legend for quick references. The color scheme is illustrated below:
- Black - Man-made features such as roads, buildings, etc.
- Blue - Water, lakes, rivers, streams, etc.
- Green - Areas with substantial vegetation (could be forest, scrub, etc.)
- Brown - Contour lines
- Red - Major highways; boundaries of public land areas
- White - Areas with little or no vegetation; white is also used to depict permanent snowfields and glaciers
As illustrated above, different colors represent different items. It is important to understand what the different colors represent so the best
route to a location can be decided. Below are common symbols that are also found on maps.
|

Cave |

Cemetery |

Church |

Falls |

Fence |

Glacier |
Improved Road |

Intermittent Stream |
Major Road |

Marsh |

Mine |
Orchard |

Primary Improved Road |
Rail Road Tracks |

Rapids |

River |

School |

Secondary Improved Road |

Spring |

Stream |

Trail |

Unimproved Road |

Waterfall |

Well |
Wooded Area |
|
As noted in the images above, different symbols stand for different items on a map. This is especially useful when you are looking for specific
resources such as a water source or a hospital. Now that you have found what you are looking for, you must plan on the most efficient route
getting there. This is where contour lines come in.
Contour lines, also known as isolines, are the squiggly lines on the map that shows the constant height of a curve and, when used together, are
used to represent the slope of a mountain or hill. There are many different types of contours and maps use at least two of them to represent the
height of a mountain. Below is a breakdown of the different types:
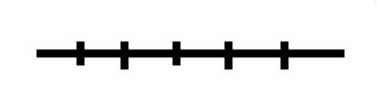
- Index Contour – Thick contour lines that have elevation printed on them periodically.
- Intermediate Contour – Contour lines that are used in between index contours that represent elevation change.
- Supplemental Contour – Contour lines, normally dashed, are contour lines that represent smaller elevation changes than that of intermediate contour lines.
- Closed Depression – Close depressions are contour lines that are normally circular in nature and have small tic marks perpendicular to the main contour pointing downward. A closed depression represents a sink hole or a crater.
Once the contour lines have been identified, the user can determine the different elevation changes that lie between them and their target. More
importantly, the scout can determine the extremity of the change. The closer together the contour lines are, the more extreme the change, and
while there are more space between the lines, the gentler the change. The listing below illustrates the different scenarios associated with
contour lines.
- Gentle slopes - Contours lines are spaced far apart
- Gentle slopes - Contours lines are spaced closely together
- Valley - Contours lines form a V shape pointing towards the hill
- Ridges - Contours lines forming a V shape pointing down the hill
- Summit - Contours lines forming a circle
|
|
|
Now that the path has been identified and the contour lines evaluated, users can start on the trail to reach their destination right? Not quite.
The last item that has to be taken into consideration is to evaluate the distance and the path used to reach their destination. Just because a
trail doesn’t cross multiple contour lines, meaning not a lot of elevation change, doesn’t mean that the trail is the most efficient route. There
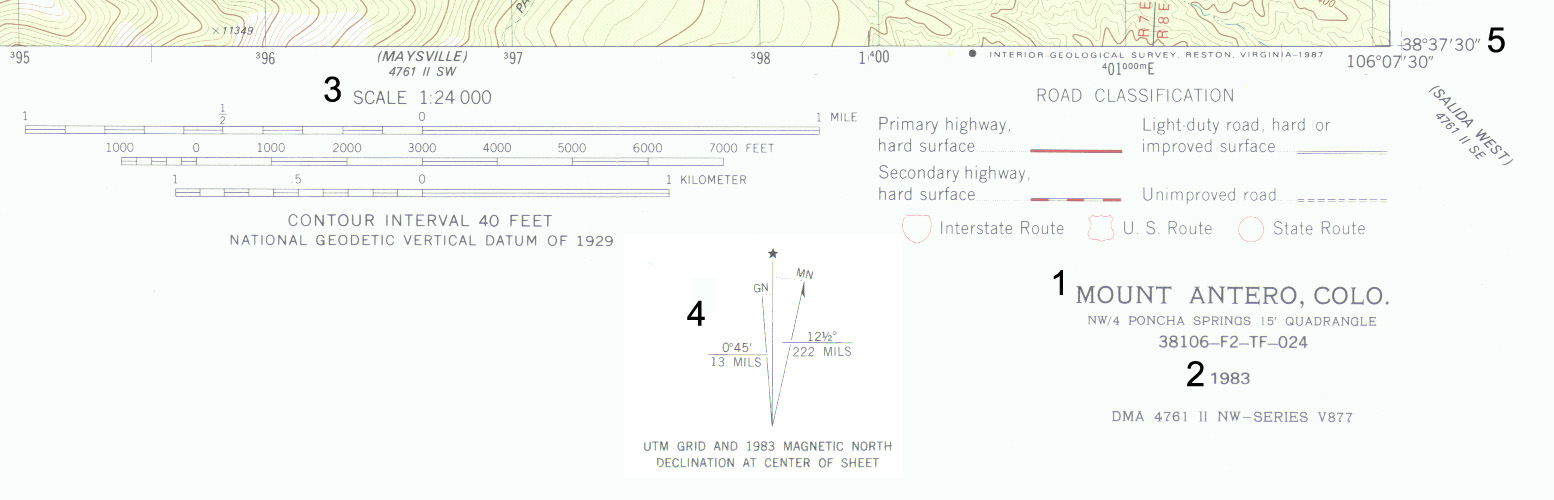
may be a trail that is shorter but a bit more strenuous. Every map has a map legend which contains different information. At the minimum the maps
should contain the following:
- Map Name (Location)
- Year of production
- Map Scale
- Magnetic Declination
- Longitude and Latitude
|
|
|
|
By measuring the distance on the trail and comparing the distance with the map scale, the user can determine the true distance of the trek.
The best way to measure distance is to measure the line of the trail that the user is planning to use with a string and then measure the string.
The second method is by using the compass to calculate the distance. While this is faster, it is also not as accurate. As such we recommend users
to add 10% of the total distance to their calculation so they are more conservative.
|
|